Community Reports
Asian Americans and Native Hawaiian and other Pacific Islanders in Los Angeles County, California
May 1, 2026
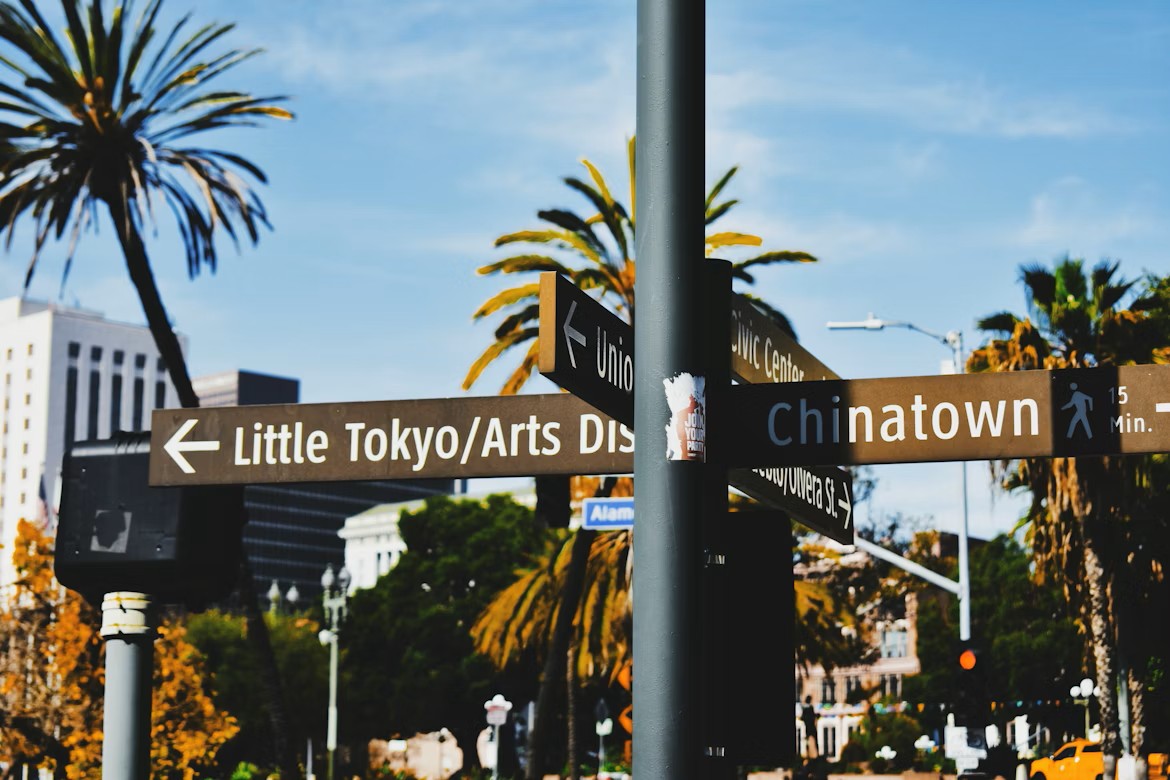
Los Angeles County in California has the largest Asian American community and the third largest Native Hawaiian and other Pacific Islander (NHPI) community among all U.S. counties. Nearly 1.7 million Asian Americans and 56,000 NHPIs live in Los Angeles County, California. Asian Americans make up 17% and NHPIs make up 1% of Los Angeles County’s total population.
From 2010 to 2020, the Asian American population in Los Angeles County grew by 13%, while the NHPI population increased by 3%. In contrast, the White population declined by 6%.
Chinese Americans are the largest Asian American ethnic group in Los Angeles County, totaling nearly half a million. Filipino (419,187), Korean (230,009), Japanese (139,434) and Vietnamese Americans (125,374) follow in number. Samoan Americans are the largest NHPI ethnic group with over 16,000 living in Los Angeles, followed by Native Hawaiians (nearly 16,000). Chamorros (4,772), and Tongans (3,320).
Bangladeshi Americans were the fastest-growing Asian American ethnic group, with a 65% population increase between 2010 and 2020. Among NHPIs, Fijian Americans experienced the fastest growth in population, rising by 54% during the same period.
With a median age of 33 years, NHPIs are among the youngest racial groups in Los Angeles County, only slightly older than Latinos (32 years). Asian Americans have a median age of 40 years, older than the population in general (37 years), yet younger than non-Hispanic Whites (45 years).
Mongolian (27 years), Hmong (27 years), and Samoan Americans (29 years) are among the youngest AANHPI ethnic groups based on median age in Los Angeles County, whereas Burmese (44 years), Japanese (42 years), and Korean Americans (42 years) are among the oldest.
Latinos have the largest share of youth ages 17 years and under among racial groups (27%), followed by NHPIs (25%). Asian Americans have the second largest share of older adults ages 65 and older (17%), smaller than that of Whites (21%) yet larger than the total population (14%).
Among NHPI ethnic groups, Tongan (35%), Samoan (33%), and Chamorro Americans (27%) have the largest proportions of youth ages 17 years and under. Among Asian ethnic groups, Hmong (28%), Mongolian (27%) and Afghan Americans (26%) have the largest proportions of youth ages 17 years and under, whereas Japanese (21%), Korean (19%) and Sikh Americans (19%) have the largest proportions of older adults ages 65 and older.
In 2022, nearly 60,000 businesses in Los Angeles County were owned by Asian Americans. These Asian American-owned businesses generated nearly $119 billion in revenue, employed more than 400,000 people, and paid over $18 billion in payroll. In the same year, 604 businesses were NHPI-owned and generated nearly $1.4 billion in revenue, employed over 4,000 people, and paid over $211 thousand in payroll.
Los Angeles County is home to nearly 6.4 million voting-age citizens (6,387,003), including 1,044,898 Asian Americans and 38,772 NHPIs.
The majority (78%) of Los Angeles County’s Asian American voting-age population (i.e., 18 years old and above) are citizens. Nearly 90% of the NHPIs in Los Angeles County who are of voting-age are citizens.
Among Asian Americans, Vietnamese, Cambodian and Taiwanese Americans have the highest rates of citizens of voting age: 88%, 88%, and 84%, respectively. Native Hawaiian and Samoan Americans have the highest rates of voting-age citizens among NHPIs, at 98% and 93% respectively.
Los Angeles County is home to more than 3 million foreign-born residents, including 977,193 Asian Americans and 12,855 NHPIs. Chinese (321,432), Filipino (234,321) and Korean Americans (142,321) are the largest foreign-born communities across Asian American ethnic groups.
The majority of Asian Americans in Los Angeles County (58%) are foreign-born, the highest proportion among all racial groups. Among Asian Americans, Burmese (78%), Korean (62%), and Chinese Americans (62%) have the highest percentages of foreign-born populations. In contrast, the majority of Japanese Americans are U.S.-born, at 74%. Over 22% of NHPIs are foreign-born. Among NHPIs, only 3% of Native Hawaiians are foreign-born, lower than any racial or ethnic group countywide.
About 67% of foreign-born Asian Americans and 63% of foreign-born NHPIs in Los Angeles County are naturalized citizens. Vietnamese (83%), Cambodian (81%) and Taiwanese Americans (78%) have the highest naturalization rates among Asian Americans.
There are no official estimates of the number of undocumented Asian American immigrants in Los Angeles County. However, based on analysis of data from the U.S. Department of Homeland Security and the U.S. Census Bureau’s American Community Survey data, it is estimated that Los Angeles County is home to approximately 894,496 undocumented immigrants, nearly 16% of whom are Asian (138,885). Filipino, Chinese and Korean Americans have the largest numbers of undocumented individuals, all exceeding 30,000.
Over 1 million individuals living in Los Angeles County speak an Asian or Pacific Islander language. Chinese (379,729) is the most spoken Asian language, followed by Tagalog (225,378) and Korean (164,112). Over 157,000 individuals speak other diverse Asian or Pacific Islander languages.
About 70% of Asian Americans and 36% of NHPIs in Los Angeles County speak a language other than English at home. Among Asian Americans, Taiwanese (83%), Burmese (81%) and Korean Americans (78%) are most likely to speak a language other than English at home. Among NHPIs, 36% of Samoan Americans and 15% of Native Hawaiians speak a language other than English at home.
In Los Angeles County, one-third (34%) of Asian Americans and 9% of NHPIs are limited English proficient (LEP), which means they speak English less than very well. Burmese Americans have the highest LEP rates at 51%, followed by Vietnamese (47%), Thai (45%) and Korean Americans (45%).
While Asian Americans adults (54%) are more likely than other racial groups to have a college degree, less than one third of NHPIs (32%) are college graduates in Los Angeles County.
Among Asian American ethnic groups, Taiwanese (74%) and Asian Indian Americans (73%) are most likely to hold a Bachelor’s degree or higher. In contrast, Cambodian (25%) and Vietnamese Americans (35%) are the least likely to have a Bachelor’s degree or higher. Among NHPIs, only 20% of Samoans have a Bachelor’s degree or higher.
The per capita income of Asian Americans is higher than the county’s average ($41,147 versus $37,924), whereas NHPIs earn significantly less per capita ($33,984). Among Asian ethnic groups, Cambodian and Vietnamese Americans have the lowest per capita income ($24,304 and $31,946, respectively). Samoan Americans have a per capita income of $26,133.
The median household income in Los Angeles County is $76,367. Across racial groups, White households have the highest median household income ($96,794), followed by Asian American ($89,498) and NHPI ($85,928) households. Among Asian Americans, Asian Indian ($121,505), Filippino ($106,189) and Taiwanese ($101,752) households have the highest median household income, whereas Cambodian ($68,050) and Korean ($70,210) households have the lowest median household income.
About 11% of Asian Americans and 12% of NHPIs in Los Angeles County live in poverty. Pakistani (19%), Cambodian (17%), and Burmese Americans (16%) have the highest poverty rates among Asian Americans, exceeding the county rate of 14%. Samoan Americans have the highest poverty rate among NHPIs, at 19%.
Latino residents (41%) are the most likely to be low-income, whereas Asian Americans (24%) are the second least likely to be low-income. Approximately 29% of NHPIs are low-income, below the county rate of 32%. Among Asian Americans, Cambodian (37%), Pakistani (35%) and Vietnamese Americans (31%) in Los Angeles County are more likely to be low-income, whereas Asian Indian (16%), Japanese (17%) and Filippino Americans (17%) are the least likely to be low-income. Samoans also have a very high low-income rate, at 35%.
Over 4% of households in Los Angeles County receive cash assistance benefits from government programs. About 3% of Asian American households and 5% of NHPI households receive cash public assistance. Among Asian American ethnic groups, Cambodian (7%), Vietnamese (4%), and Filipino American (4%) households have the highest proportions of households receiving cash public assistance. Samoan American households also have an above-average proportion (6%) that receives cash public assistance.
In Los Angeles County, Black or African Americans have the highest unemployment rate (11%) among racial groups, much higher than the county average (7%). NHPIs also have a higher-than-average unemployment rate (8%), with Samoan Americans having the highest unemployment rate (12%). Asian Americans have the lowest unemployment rate across racial groups, at 6%.
Among Asian ethnic groups, Pakistani (9%), Indonesian (8%) and Cambodian Americans (8%) have the highest unemployment rates, whereas Thai Americans have the lowest unemployment rate (5%).
In Los Angeles County, management and professional occupations are the most common employment sector among Asian Americans and Native Hawaiians and Pacific Islanders (NHPIs), accounting for 53% and 39% of their respective labor force populations. These occupations include managerial roles and professional positions that typically require specialized knowledge or advanced education, in fields such as business, finance, engineering, science, education, healthcare, and arts. Among Asian ethnic groups, Taiwanese (71%), Asian Indian (68%), and Japanese Americans (57%) are the most likely to work in management and professional occupations.
Sales and office occupations are the second most common type of employment among Asian Americans (21%) and NHPIs (26%). Across Asian ethnic groups, Indonesian (25%), Cambodian (23%), and Korean Americans (23%) are most likely to be employed in these occupations, while Thai (17%) and Asian Indian Americans (18%) are the least likely. Among NHPIs, Native Hawaiians and Samoan Americans have large shares of workers in sales and office occupations, at 28% and 23%, respectively.
About 15% of Asian Americans and 17% of NHPIs are employed in service occupations. Among Asian Americans, Thai (32%) and Vietnamese Americans (23%) have disproportionally larger shares of workers in service occupations. Among NHPIs, 19% of Samoan Americans and 16% of Native Hawaiians are employed in service occupations.
About 11% of Asian Americans and 18% of NHPIs are employed in construction, production, transportation & material moving occupations. Among AANHPI ethnic groups, Samoans (25%), Burmese (22%) and Cambodian Americans (20%) are most likely to be employed in these fields.
Among the three AANHPI ethnic groups with the highest poverty rates, management and professional occupations remain the most common type of employment. About 51% of Pakistani, 34% of Samoan, and 39% of Cambodian Americans are employed in these occupations. Sales and office occupations are the second most common among Pakistani (22%) and Cambodian Americans (23%), whereas construction, production, transportation, and material moving occupations rank the second common among Samoan Americans (25%).
About 54% of Asian Americans in Los Angeles County own their homes, a higher rate than that of the total population (46%). The homeownership rate of NHPIs is 42%, higher than that of Latinos (40%) and Black or African Americans (33%).
Mongolian (20%), Samoan (27%), and Hmong Americans (27%) have the lowest homeownership rates of any racial or AANHPI ethnic groups in Los Angeles County.
About 13% of NHPIs and 9% of Asian Americans live in overcrowded housing, which is defined as having more than one person per room. Among Asian ethnic groups, Pakistani (21%), Cambodian (16%) and Burmese Americans (15%) have the highest rates of living in overcrowded housing.
Every one in four Samoan Americans (25%) live in overcrowded housing, a rate higher than that of any racial or AANHPI ethnic group in Los Angeles County.
Renter households are considered to be housing-cost burdened if households spend more than 30% of their income on housing expenses, including rent and utilities. More than half of Asian American (53%) and NHPI (51%) renters in Los Angeles County are housing-cost burdened, lower than that of the total population (57%).
Pakistani (61%), Korean (60%), Cambodian (59%) and Samoan American (59%) renters have the highest rates of households that are housing-cost burdened among AANHPI ethnic groups in Los Angeles County.
Over 9% of residents in Los Angeles County do not have health insurance. The uninsured rates among Asian Americans (5%) and NHPIs (8%) are lower than the overall population, while Latinos (13%) and American Indian and Alaska Natives (10%) have the highest uninsured rates among racial groups.
Mongolian Americans (17%) have the highest uninsured rate of any racial or AANHPI ethnic groups in Los Angeles County. Korean (9%) and Nepalese Americans (8%) also have relatively high proportions of those without health insurance.